
In keeping with this month’s theme, I thought I would provide a basic introduction to a risk assessment technique that in my opinion has been somewhat neglected recently. Decision tree analysis has been around since the early 1950s but is as useful today as it was back then — maybe even more so.
Now, I want to give you fair warning: This column will involve some basic math — and I know how many lawyers feel about that. But the math we will be applying is very simple, very useful, and, I think, a lot of fun once you understand the concepts, so try to bear with me.
I’m going to describe decision tree analysis by applying it in a context that will be familiar to most lawyers: litigation. In fact, some of you may have been exposed to or at least heard the acronym “LRA” (short for litigation risk analysis), which is how decision tree analysis is often referred to in the context of litigation. But you could just as easily use this analysis to determine whether it is better for your company to buy or lease a building, license or build your law department’s own matter management system, etc.
Let’s say you have a simple slip and fall case in which your corporation is the defendant. The plaintiff claims your client has been grossly negligent and acted in bad faith, and he is seeking damages not only for the injury but also punitive damages for emotional distress. He has made a settlement demand for US$250,000.
Let’s evaluate that demand using decision tree analysis. So, what tools do you use for this? My favorite is old-school Excel, but any spreadsheet program (Numbers for Mac or iOS, Sheets in Google Docs, etc.) will work fine. What’s nice about working in a spreadsheet is that you can play with the assumptions and see on a real-time basis how modifications affect the outcomes.
What we are trying to determine is the litigation’s Risk Neutral Settlement Value (RNSV). If done properly, it should give you the most objective valuation of the case using probability math. In the diagram below, we have built a decision tree that captures the most likely basic outcomes if we litigate the case. Reading from left to right, either your company will be found negligent or not. If it is found negligent, the court will either impose punitive damages or not.
The best practice for creating an LRA is to convene a team of experts (e.g., your outside counsel, your risk manager, your most knowledgeable client) to help (1) identify all the likely (greater than 5 to 10 percent) outcomes, (2) determine the likely damages resulting from each outcome, and (3) estimate the probability that each outcome will occur. In the example that follows, it is this team of experts that has assigned values and probabilities to the various outcomes.
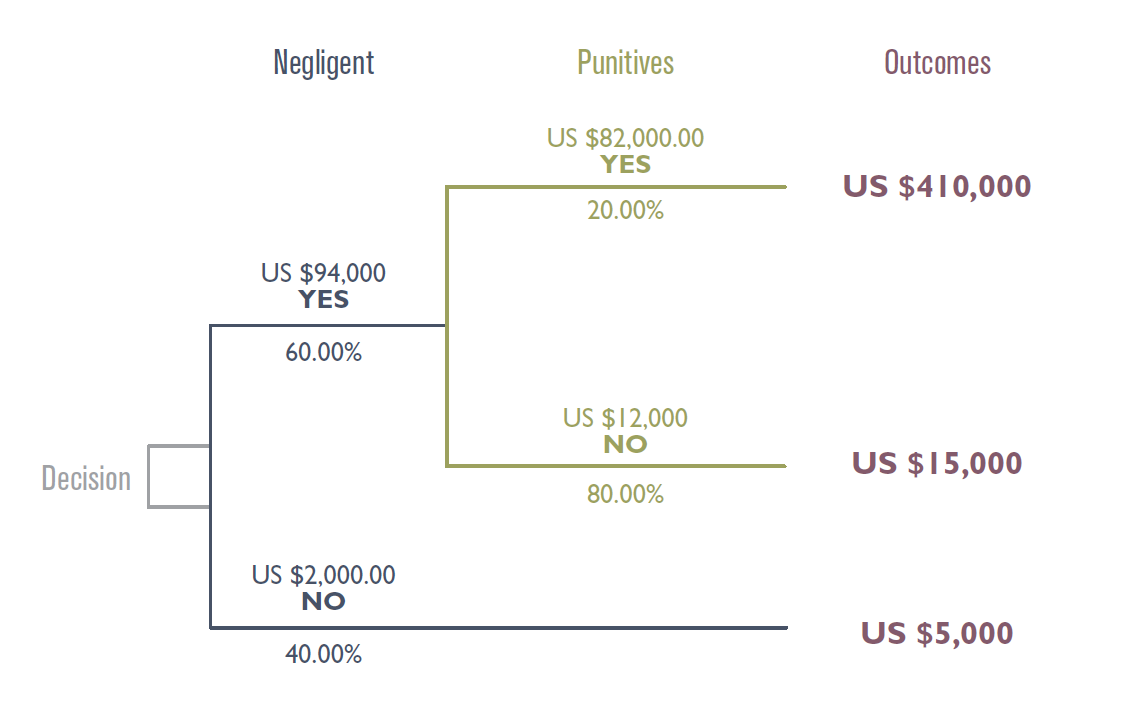
Now let’s look at the potential outcomes in the right-hand column. Starting at the second number from the bottom, if your company is not found negligent, all it would be liable for are court costs and attorney’s fees, which we are estimating will be on the order of US$5,000. Going to the next number up, if the court finds your client negligent but does not feel punitive damages should be imposed, we estimate that there will be damages of US$10,000 plus the same US$5,000 in court costs and attorney’s fees, for a total of US$15,000. Finally, the top number is the estimated outcome if the court does impose punitive damages, consisting of US$400,000 in total damages and US$10,000 in court costs and attorney’s fees (higher because once punitive damages are allowed you tend to spend more in attorney’s fees). Good so far?
Next, let’s look at the probabilities that each outcome will occur, which are captured in the percentages below each branch. The way probability math works is that the likelihood of all the outcomes stemming from any single branch must equal 100 percent. So, reading from left to right, we are estimating that there is only a 40 percent chance that the court will not find your client negligent. Since there are only two branches/two potential outcomes, this means that there must be a 60 percent chance that the court will find your company negligent. Similarly, we are estimating that there is an 80 percent chance the court will not impose punitive damages, which means there is a 20 percent chance that it will.
Now for the math — which is super simple to do on a spreadsheet. The laws of probability state that the value of any branch is equal to the probability of an outcome times the value of that outcome.
Look at the value of the top branch captured in the second column from the right, which is shown as US$82,000. This is calculated by multiplying the probability of that branch (20 percent) times the value of that branch (US$410,000). Similarly, the value given for the next branch down of US$12,000 is calculated by multiplying the probability of that branch (80 percent) times the value of that branch (US$15,000).
Okay, then what about the US$94,000 above the next branch to the left? That is calculated by just adding up the sum of the values of the branches stemming from it (US$82,000 + US$12,000). The US$2,000 just below that is simply the 40 percent probability of that branch happening times its value of US$5,000.
So, where does all this take you?
As mentioned above, I always recommend creating a risk analysis with the active input of every expert involved in the case: your inside and outside counsel, your risk manager, or claims professional, etc. Just discussing why each expert assigns a particular value and probability to a given outcome can be enormously valuable, and studies have shown that experienced litigators will be surprisingly consistent in their evaluations if they are all working from the same assumptions. Discussing those assumptions in this context will help everyone understand the case better.
Second, an LRA of this sort is great backup for setting reserves on any high impact cases. Auditors and CFOs love these things once they understand them.
Third, plaintiffs often have inflated notions of the values of a particular case. Showing them your risk analysis and challenging them to rebut your assumptions can often lead either to their lowering their expectations or revealing information that might dramatically raise yours. Either one is a win for your client.
And again, if you create these in a spreadsheet, you can make the variety of outcomes as complicated as you need, potentially with dozens of branches, and can update and adjust your assumptions as more facts come to light, and the calculations will automatically flow through to make sure you always have an up-to-date analysis. I’ve created these for very high stakes litigation involving all kinds of possible outcomes, such as winning a motion to dismiss, winning motions for summary judgment, conversion to a class action, and others. Once you understand the principles, you will find these a lot easier and more fun to build than you might think, and they can be really valuable — to your company and to your own reputation within it.